
When it comes to lineworkers, public power utilities need to be able to assess if they’re paying competitively. Utilities paying less than competitive wages have a higher risk of losing qualified individuals to nearby investor-owned utilities, cooperatives, or other public power utilities.
In a previous blog, we took a look at general manager compensation and described how you can tell if you are “paying with the pack.” We explained that public power utilities pay in line with electric revenues, and created a graph that showed a “danger zone” where general manager compensation is below a competitive rate based on the utility’s revenue.
As a whole, public power utilities pay less than cooperatives and IOUs. For example, for certain revenue classes, general managers of electric cooperatives are compensated twice as much as general managers of public power utilities. The pay gap for lineworkers is not quite as steep, yet public power lineworkers are generally paid less than their fellow cooperative and IOU lineworkers. Therefore, if your lineworkers are earning less than their public power counterparts at similarly sized utilities, they are almost certainly making substantially less than their cooperative and IOU counterparts.
Based on information submitted through our annual salary survey, we identified a typical hourly range for lineworker pay based on utility attributes and built a model, so you can see how competitively you pay lineworkers.
The graph below shows how the pay curves calculate out across the entire data set. The y-axis shows average hourly lineworker pay, as provided by public power utilities in our annual salary survey. The cluster of blue cells show the range of hourly pay scales for each utility used to develop the model, and the further a utility is removed from the orange line, the more that utility is above or below average lineworker pay.
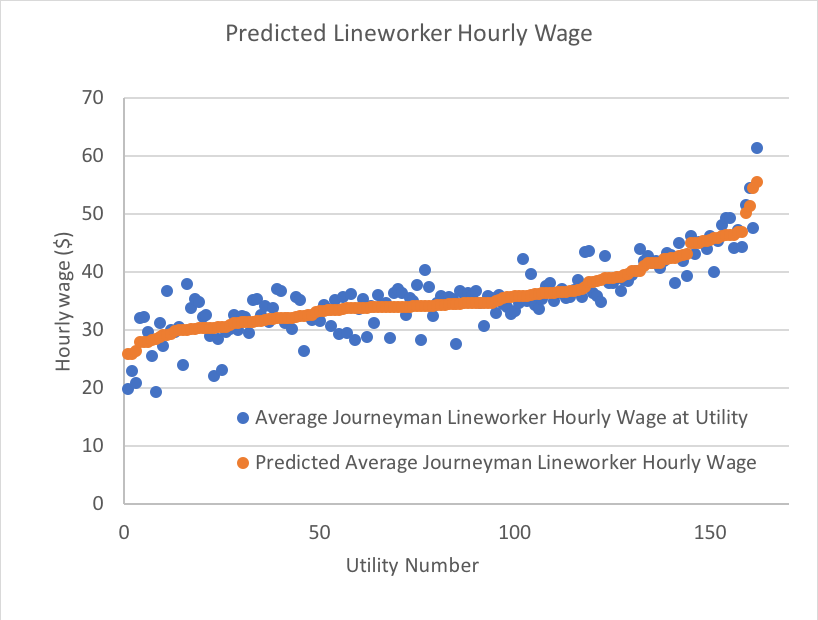
Digging into the data further, the values we found to be most significant in calculating hourly pay included region, union status, and utility revenue.
To make this data more actionable for you, we put our model for calculating a utility factor-adjusted estimate of average pay in an easy-to-use spreadsheet. The Public Power Lineworker Hourly Wage Estimator allows you to input various utility factors, such as region and revenue, to calculate a close estimate to average utility-wide journeyman lineworker pay. This calculation can be used to produce an estimated average lineworker hourly pay specific to your utility.
This comparative tool can help address several common pay setting challenges. In particular, it can help you make the case to pay lineworkers enough to retain them while demonstrating to your customers that your employees are not overpaid. If you find you’re below or above average, that may be due to all sorts of additional factors. Use of any data set requires thinking critically about where or why certain numbers may be skewed, but having the figures from 162 public power utilities makes for a compelling data set, which we hope will make your job easier.
Try it. Let us know what you think.