
Success, in many aspects, is a result of repetition and consistency. Take fitness for example. After going on a monthly run, you may be out of breath, worn out, and sweaty. These are all expected products of exercise. However, the results of exercise - weight loss, increased energy, or better sleep - will not be evident in your day-to-day activities. You would not train for a marathon by running once a month. In competitive sports, muscle memory is what separates good from great athletes. The only way to mold muscle memory to repeat the same impeccable golf swing or jump shot is compulsive consistency and repetition.
It takes the same kind of deliberate focus and repetition to improve safety culture in a public power utility. How much do the products of a culture that focuses on safety – regular employee training, consistent incidence reporting, etc. – lead to a safer workplace?
In looking at data from public power utilities submitted to the Association’s Safety Awards of Excellence, across three key safety measures, utilities that submitted data each of the past five years outperformed the average.
In each chart, the blue line represents the average from all utilities who submitted data, and the yellow line represents the average for the 156 utilities that submitted data each of the past five years.

The utilities who consistently submit data have, on average, a 20.81% lower OSHA incidence rate than the overall group. The OSHA incidence rate is determined by multiplying the number of reportable cases by 200,000 worker hours then dividing by the total number of worker hours amassed at that utility. The weighting factor of 200,000 worker hours represents 100 typical full time employees working 50 weeks at 40 hours per week.
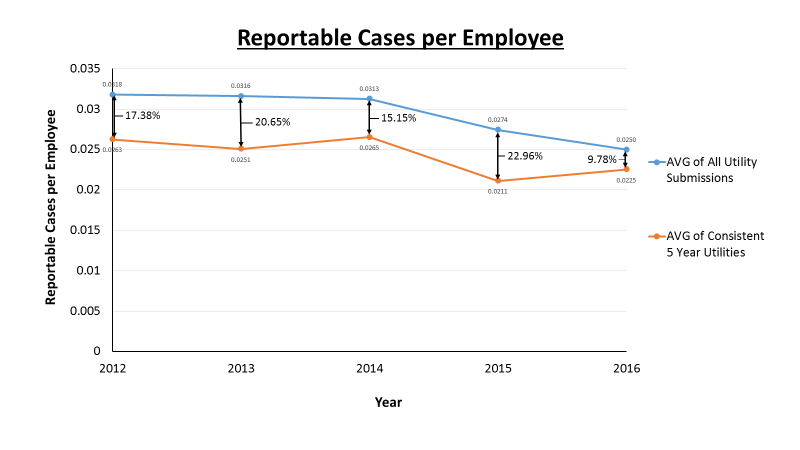
The utilities who consistently reported data also have, on average, a 17.81% lower rate of reportable incidents per employee. The number of reportable cases per employee estimates the likelihood that a case is going to occur to an individual worker over the course of one year. Since this measure focuses on the individual employee instead of category or size of multiple employees, reportable cases per employee can be a useful tool for utility management to determine how safe their workers are regardless of the utility’s size.
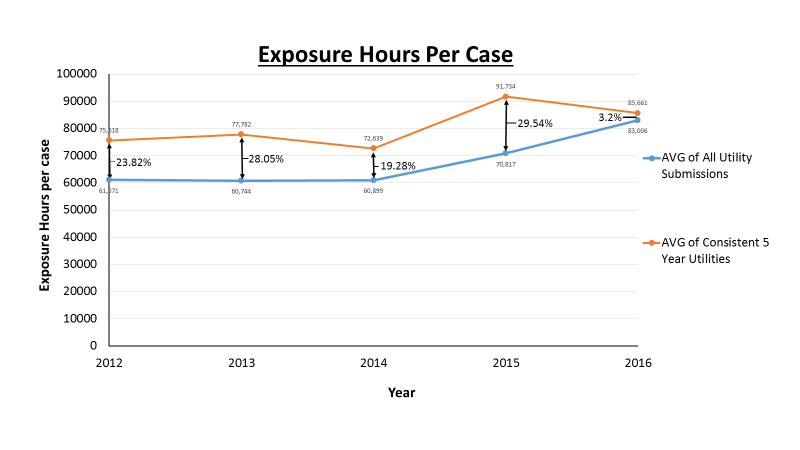
Lastly, the total hours workers clock in relative to reportable cases year to year shows that the consistently reporting utilities, on average, see more worker exposure hours per case.
Although the data is limited to a small sample from a self-selected group of utilities who hope to be recognized for their safety, all three comparisons indicate that consistency in reporting is associated with increased safety for your utility workers. There isn’t a large incentive for submitting all data, and submitting safety data only when an incentive is expected will hinder your utility from running as efficiently and safely as possible.
Submitting data on a yearly basis, regardless of the number of accidents/injuries that have occurred over the calendar year, can help you stay mindful of safety problems and respond accordingly.
The American Public Power Association collects and aggregates safety data through its annual Safety Awards of Excellence to recognize exceptionally safe performance and to set benchmarks for key safety measures for municipal utilities. Entries are sorted into groups based on the total number of hours worked by all electric utility employees during the year. Utilities with the lowest incidence rate from each group receive an award. Learn more about the awards program and view the list of previous winners.