
Electric end use is on the rise: Nearly 40% of homes in the United States are primarily heated by electricity, and electric vehicles comprised 3.4% of all light-duty vehicle sales at the end of 2021. Yet, where electric demand is growing and how electrification affects the grid varies from state to state.
This map shows the share of electricity as end-use energy in each state.
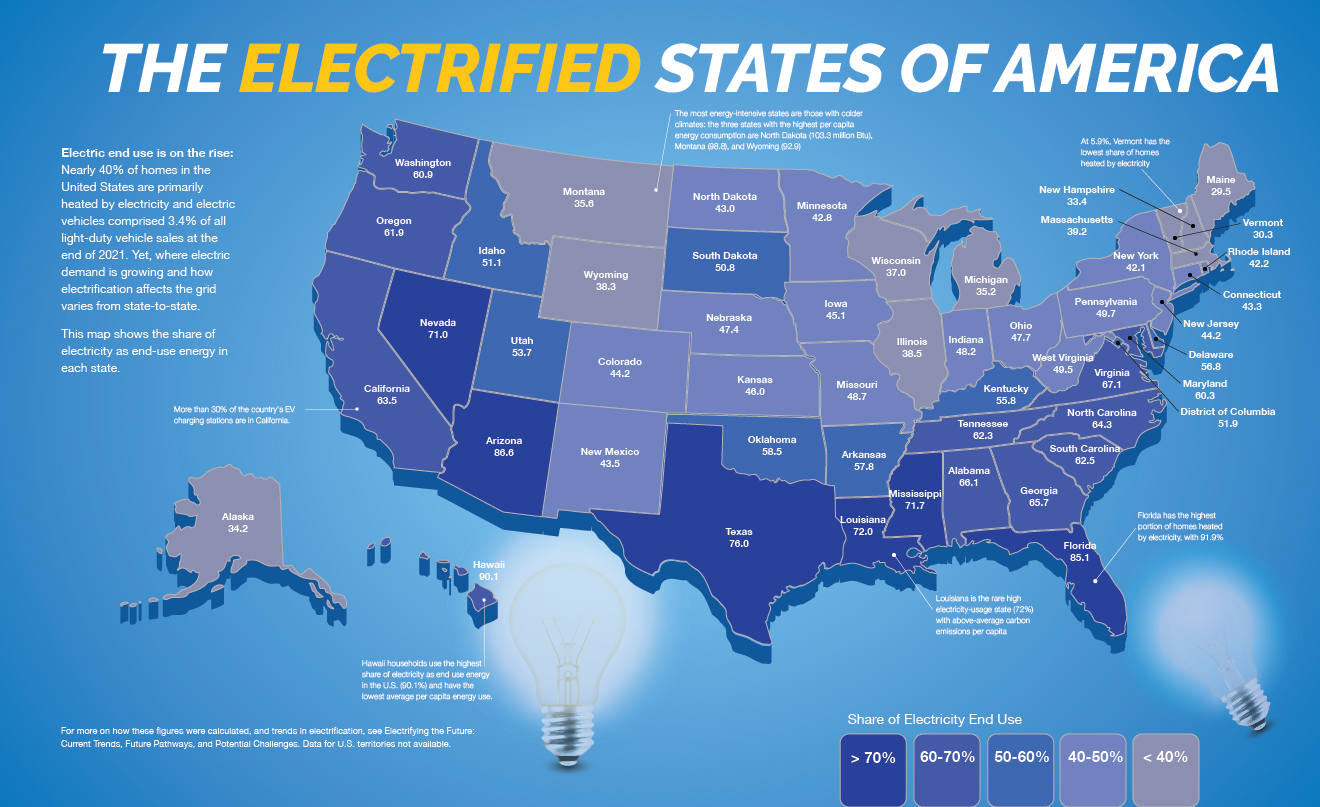
| State | Electricity usage percentage (%) |
| Alabama | 66.1 |
| Alaska | 34.2 |
| Arizona | 80.6 |
| Arkansas | 57.8 |
| California | 63.5 |
| Colorado | 44.2 |
| Connecticut | 43.3 |
| Delaware | 56.8 |
| District of Columbia | 51.9 |
| Florida | 85.1 |
| Georgia | 65.7 |
| Hawaii | 90.1 |
| Idaho | 51.1 |
| Illinois | 38.5 |
| Indiana | 48.2 |
| Iowa | 45.1 |
| Kansas | 46.0 |
| Kentucky | 55.8 |
| Louisiana | 72.0 |
| Maine | 29.5 |
| Maryland | 60.3 |
| Massachusetts | 39.2 |
| Michigan | 35.2 |
| Minnesota | 42.8 |
| Mississippi | 71.7 |
| Missouri | 48.7 |
| Montana | 35.6 |
| Nebraska | 47.4 |
| Nevada | 71.0 |
| New Hampshire | 33.4 |
| New Jersey | 44.2 |
| New Mexico | 43.5 |
| New York | 42.1 |
| North Carolina | 64.3 |
| North Dakota | 43.0 |
| Ohio | 47.7 |
| Oklahoma | 58.5 |
| Oregon | 61.9 |
| Pennsylvania | 49.7 |
| Rhode Island | 42.2 |
| South Carolina | 62.5 |
| South Dakota | 50.8 |
| Tennessee | 62.3 |
| Texas | 76.0 |
| Utah | 53.7 |
| Vermont | 30.3 |
| Virginia | 67.1 |
| Washington | 60.9 |
| West Virginia | 49.5 |
| Wisconsin | 37.0 |
| Wyoming | 38.3 |
Additional electrification facts:
- Hawaii households use the highest share of electricity as end use energy in the U.S. (90.1%) and have the lowest average per capita energy use.
- More than 30% of the country’s electric vehicle charging stations are in California.
- The most energy-intensive states are those with colder climates: the three states with the highest per capita energy consumption are North Dakota (103.3 million Btu), Montana (98.8), and Wyoming (92.9)
- Florida has the highest portion of homes heated by electricity, with 91.9%
- At 5.9%, Vermont has the lowest share of homes heated by electricity
- Louisiana is the rare high electricity-usage state (72%) with above-average carbon emissions per capita
For more on how these figures were calculated, and trends in electrification, see Electrifying the Future: Current Trends, Future Pathways, and Potential Challenges. Data for U.S. territories not available
