
Technology evolves quickly, challenging utilities to keep up. They must balance embracing the right technology that can improve customer relations, make operations more efficient, and keep systems reliable while keeping power affordable. Being part of the cutting edge of energy technology is a careful balance between exploring the possibilities and recognizing what’s not yet ready for wider application or deployment.
To help public power organizations in conducting research and development, the American Public Power Association manages the Demonstration of Energy and Efficiency Developments, or DEED, program. Over the past 40 years, public power utilities have collectively received more than $20 million from DEED to help redefine what is feasible when deploying energy technologies, better understand their systems, and discover new approaches to operations. A few organizations that recently completed DEED-funded efforts shared what they learned from their projects and what other utilities can take away from the results. These projects can serve as a roadmap for other utilities aiming to improve operations and mitigate the pressure of increasing customer demand on the grid.
AI to Support Hydro
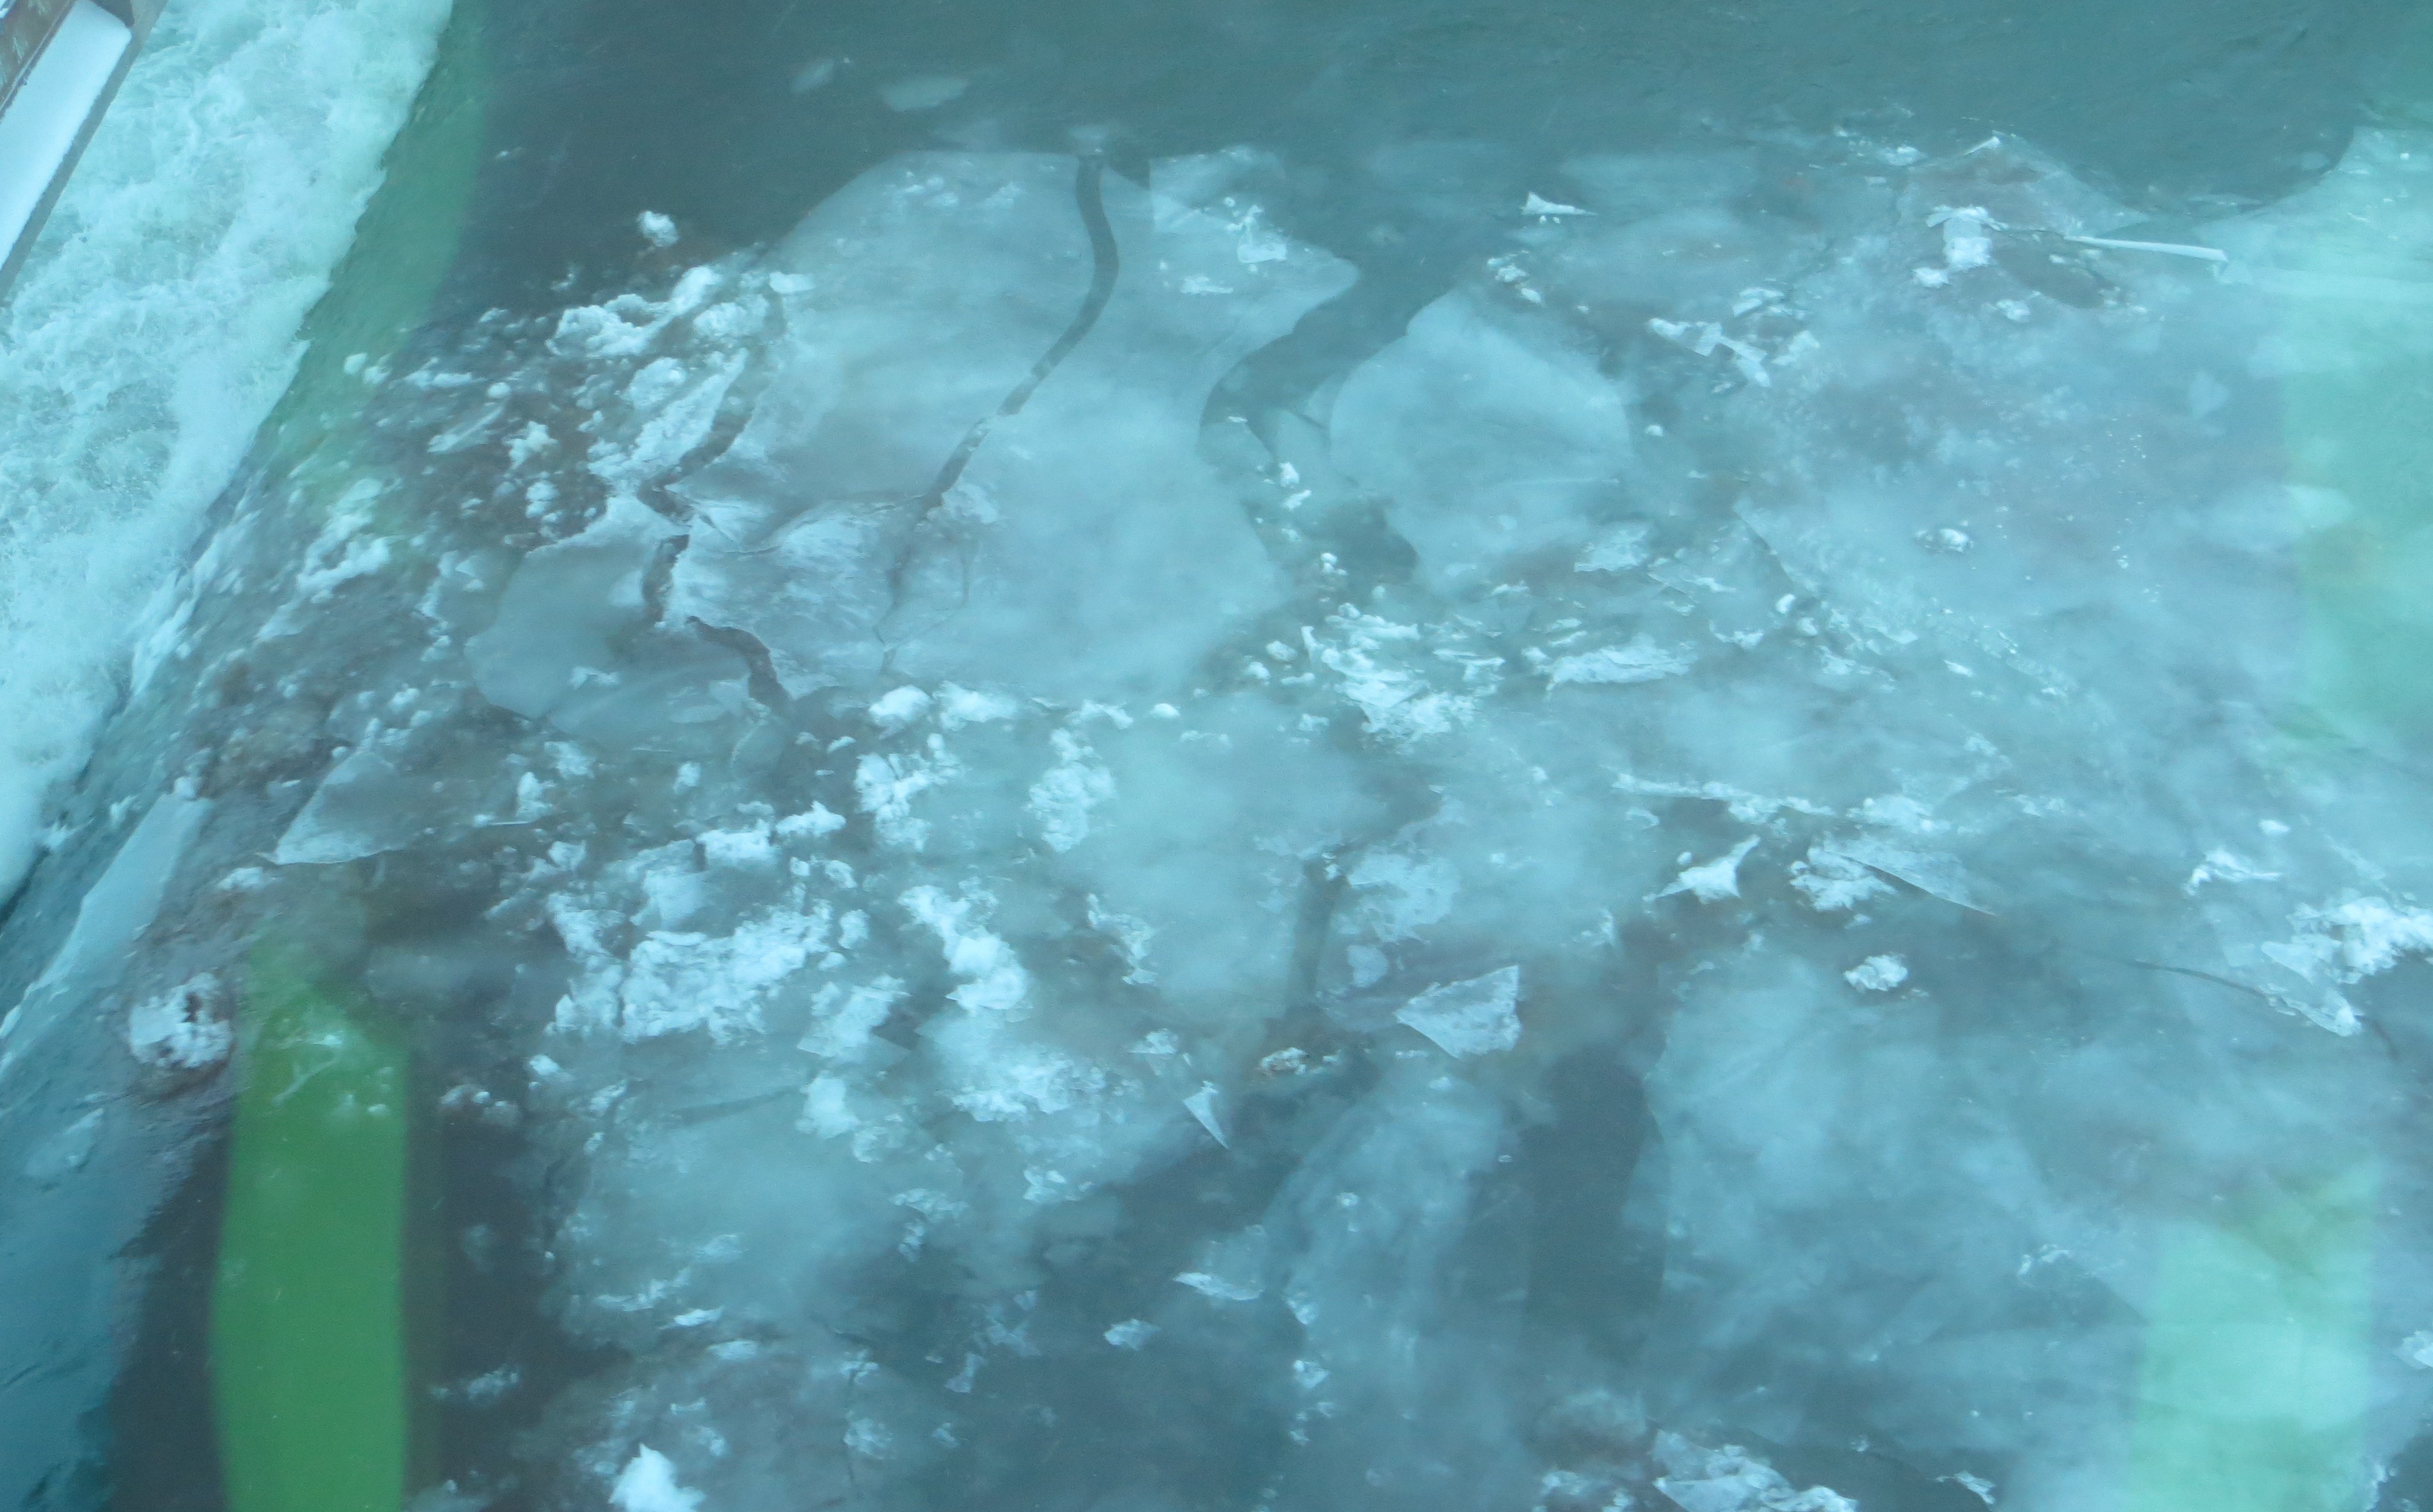
The New York Power Authority is working to better understand the impact of ice on its hydropower facilities. For years, anchor ice that forms in the Niagara River below Lake Erie has been an issue for NYPA’s Robert Moses Niagara Power Plant in Lewiston, New York. Managing the impact of this ice on the plant is critical in ensuring the required water flow and power generation, as well as avoiding costly damages to the facility.
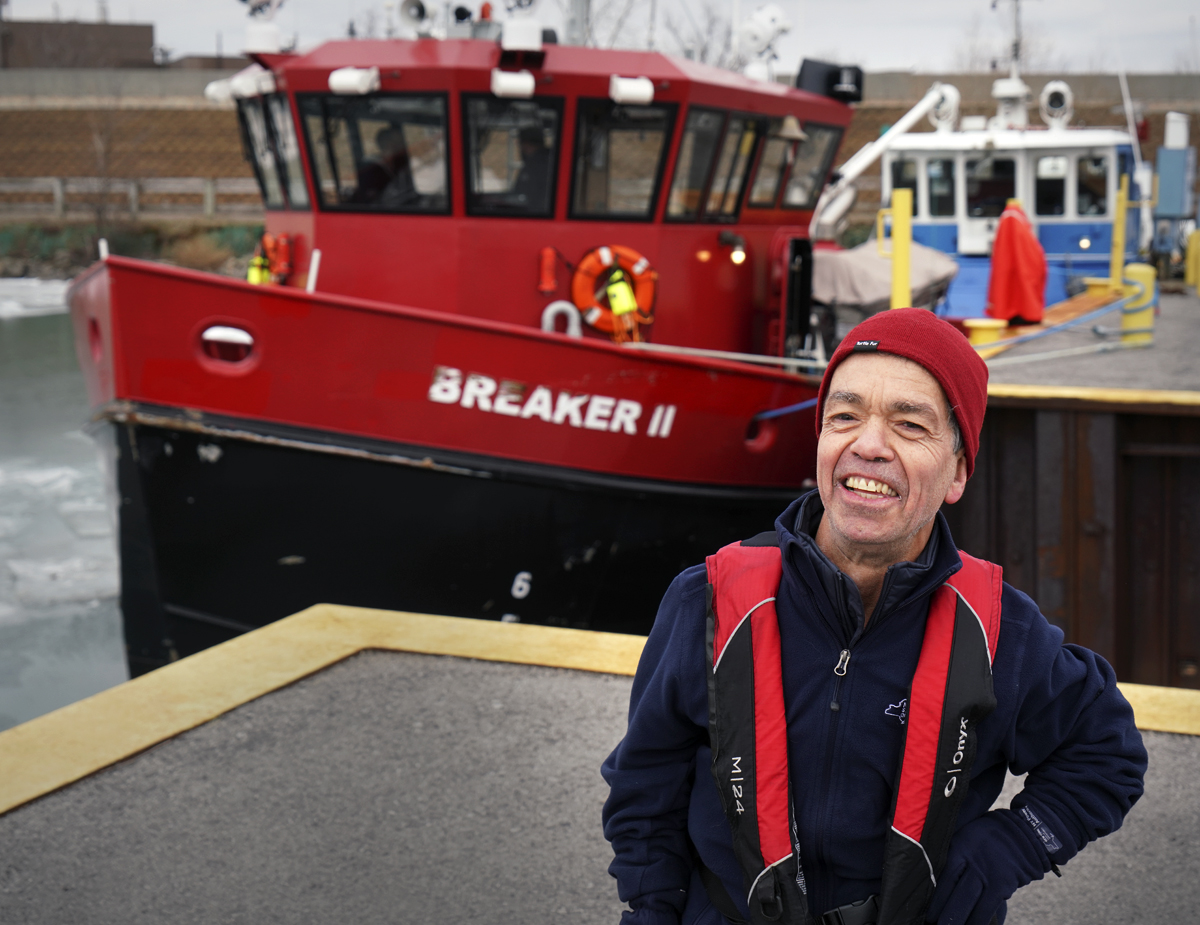
“Ice changes the flow of the water,” said Gregory Pedrick, senior research and technology development engineer at NYPA. “When water flows at full capacity, it’s at full volume through the tunnels to the power station. When ice starts to form, it displaces the water and changes the flow by up to 20%. So, if we think we have 8,000 cubic feet per second, we might only have 6,000.”
Because the power plant is just a few miles upriver from the famous Niagara Falls, it’s not a typical, run-of-the-river hydro facility. An international treaty with Ontario Power Generation’s Sir Adam Beck I Generating Station in Canada requires the facilities to manage the flow of water to provide power generation to both plants as well as the discharge necessary for tourism at Niagara Falls. The discharge flows required for the falls are 100,000 cubic meters per second during the summer tourism season and 50,000 cms during the winter. In essence, the facilities can only use the leftover water for power generation, per the treaty.
Managing ice to allow for full water volume to meet those demands is critical. NYPA was eager to develop a tool to forecast the influence of anchor ice on flow and flow restriction to provide operators with more data to anticipate ice events, predicting when events will start, when they will end, and their severity.
“Operators for years have been accumulating field knowledge and intelligence without scientific or physical dimensional analysis tools,” Pedrick said. “In 2021, we had the idea to try to make a forecasting model.”
To create the model, NYPA leveraged the expertise of a graduate student studying machine learning at Stony Brook University. The team then accumulated historical weather data from the National Oceanic Atmospheric Administration and SUNY Albany’s MESONET program. The main variables of focus for the analysis were air temperature, which can create anchor ice, and wind speed, which changes the flow of ice.
From 2021 to 2022, the graduate student built the shell of the model. The NYPA team first tested the model during the cold, early months of 2023 and 2024. The team plans to add variables that will include water temperature, cloud cover, and wind direction in future versions of the model. For now, utilizing the air temperature and wind speed is proving adequate to develop a decent anchor ice forecast.
The team measured levels at various points along the river and equated those levels to flow. They built routines and did auxiliary work to add accurate weather data to the system. They added results from various conditions, like a long cold spell versus a short cold spell, to gain more holistic data. They also added information gathered from other industry stakeholders, like a research paper on river ice levels and other studies conducted by hydro facilities operating in cold climates.
“We’re hoping to create momentum within the operations of hydro facilities,” Pedrick said. “If operations start to gain reliability in a forecasting device, they will turn to it more often. Ideally, this will be in their shortlist toolbox.”
The team continues to test the tool. Testing during ice events in early 2025 showed promise of the tool being an accessible way to predict and mitigate ice events for hydropower facilities once development is complete.
Capturing More Solar
To study ways to make more use of intermittent power generation to meet increasing peak power demand, Burbank Water and Power in California created a Long-Duration Energy Storage Demonstration Project that included the installation of an Energy Warehouse unit paired with a solar photovoltaic generating system.
“As more of these units come online, it will be beneficial to begin aggregating resources to support system conditions,” said Michael Wang, principal electrical engineer at BWP. “It is important to understand the long-term plan for these types of technologies and how they will integrate with existing systems from a technology and strategic perspective.”
BWP kicked off the project in 2022. It worked with ESS Tech, Inc., a manufacturer of long-duration iron flow energy storage solutions, which provided and installed the iron flow battery and commissioned the unit. BWP acted as the project manager, managing site improvements, permitting, interconnection design, and connecting the battery to the utility’s existing system.
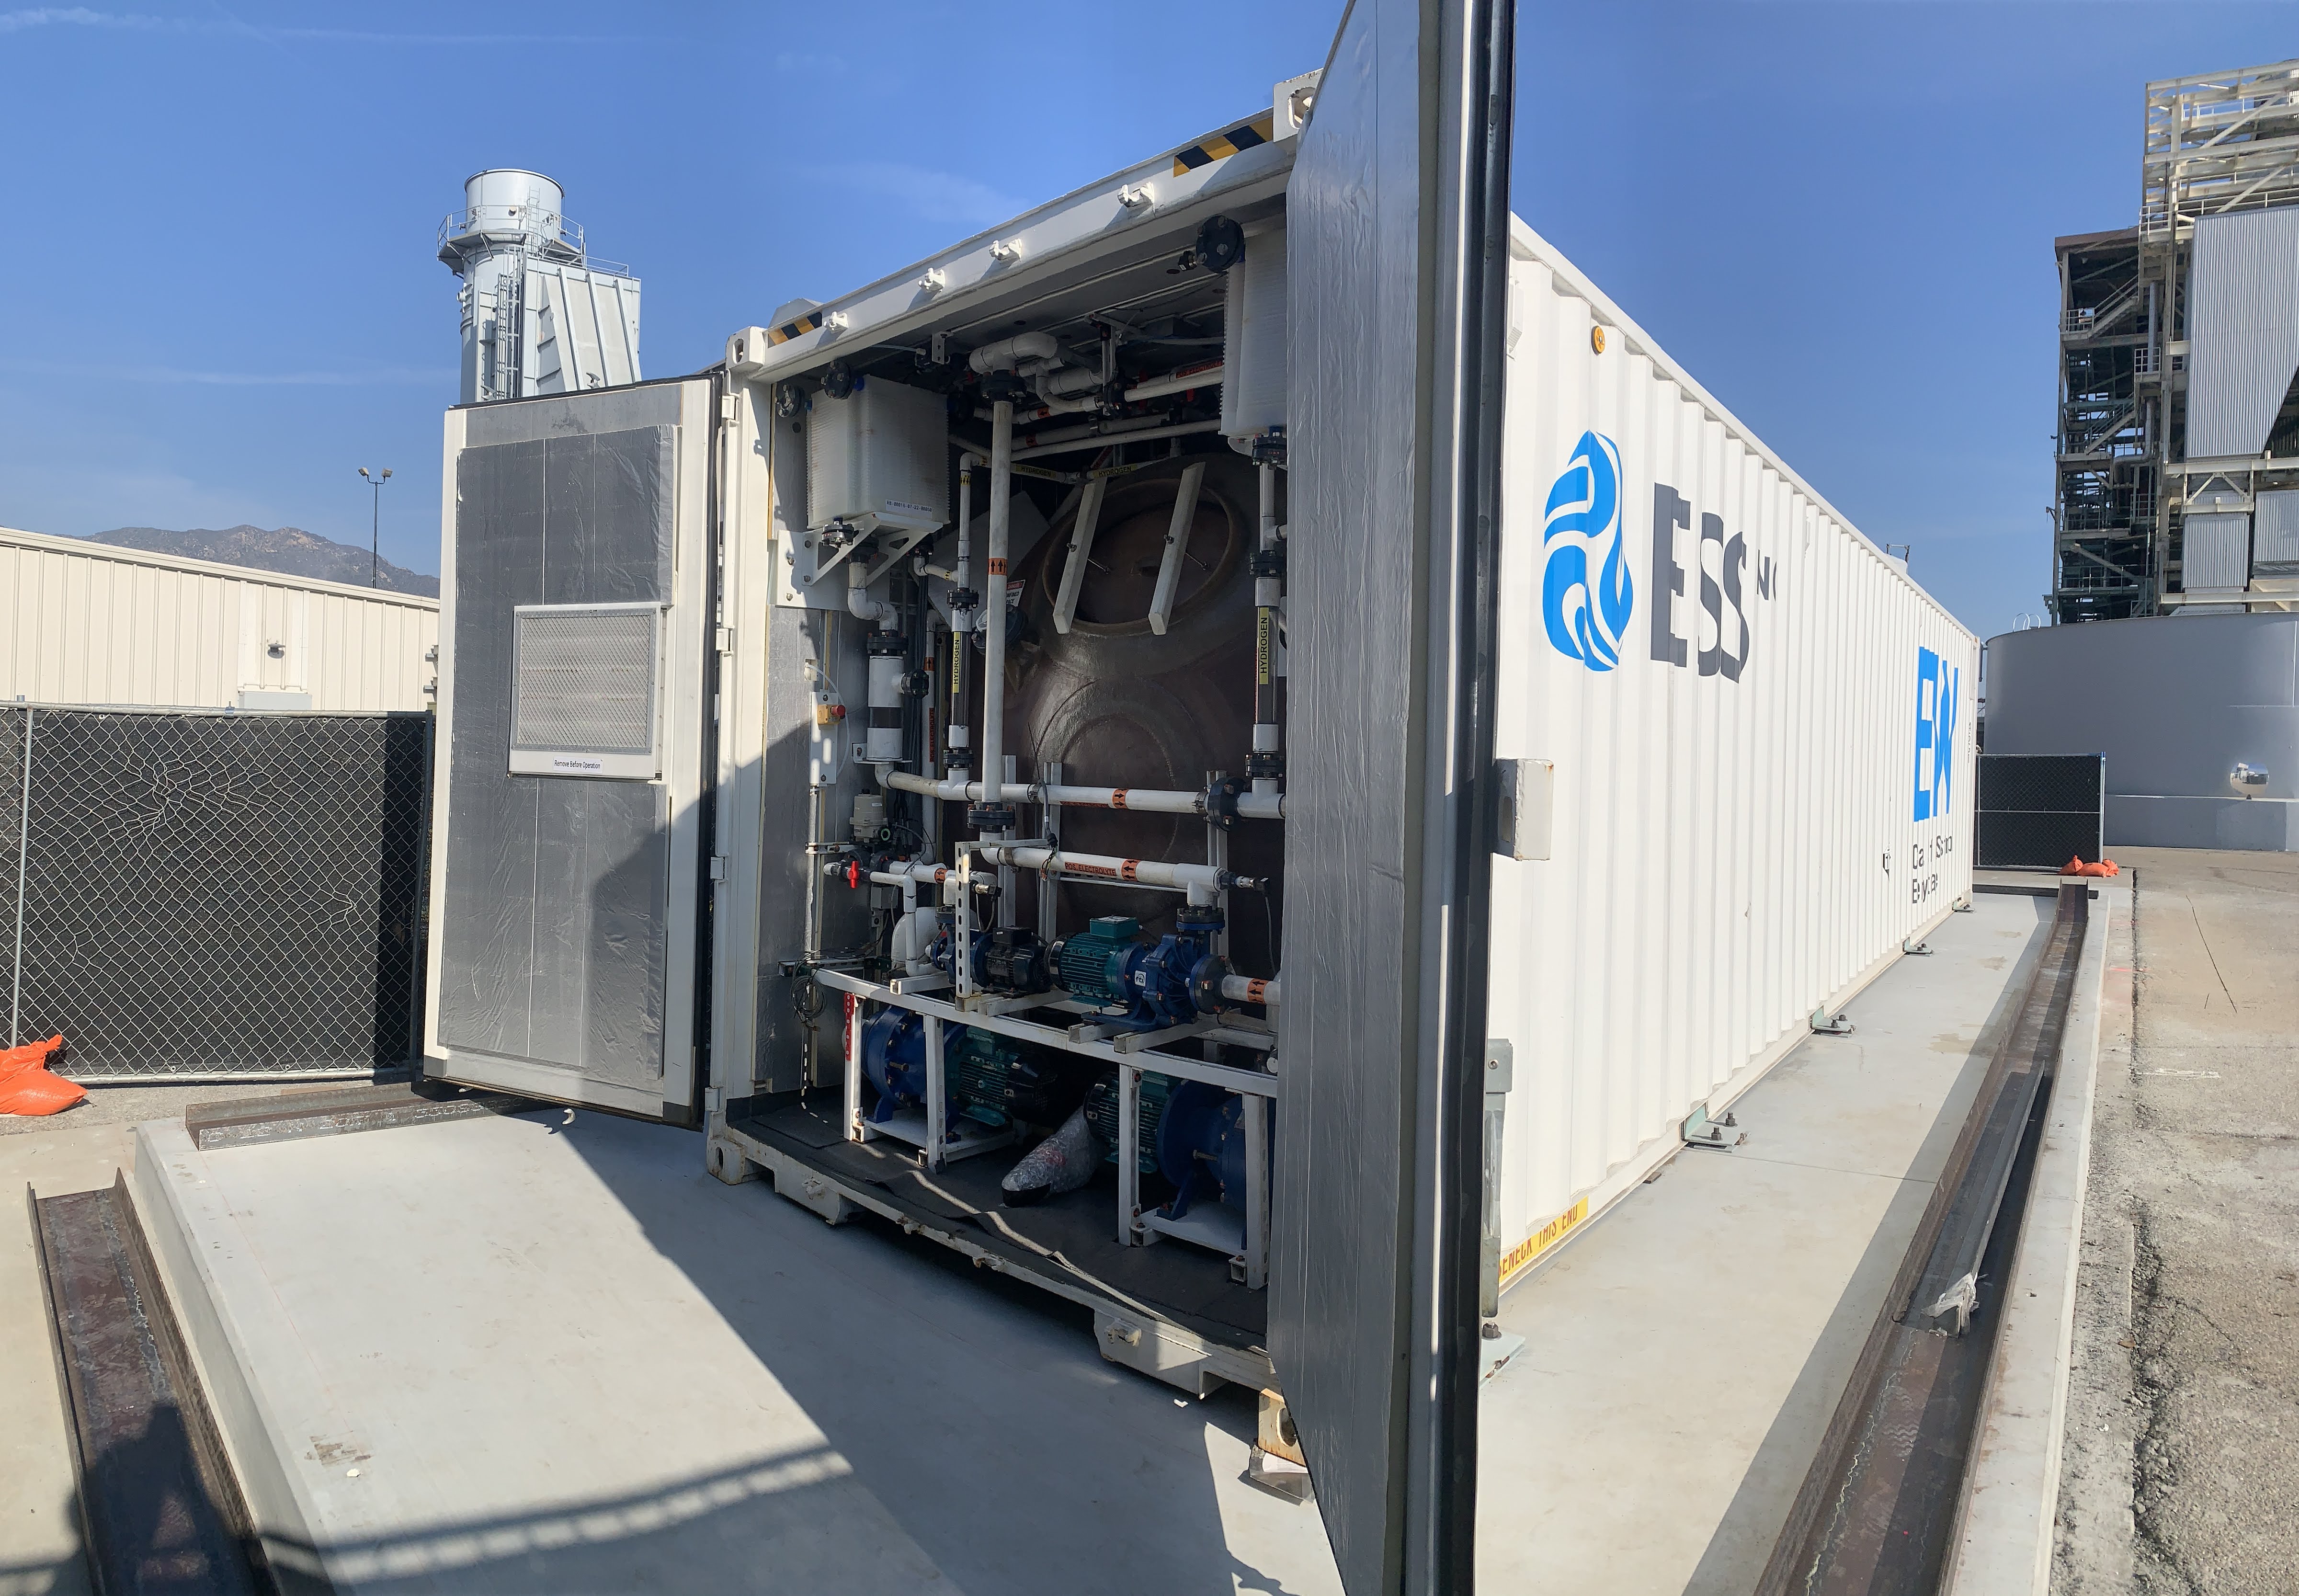
The unit has a rated power of 75 kW and stores 500kWh of energy interconnected at 480v AC in a containerized, fully integrated system that includes the battery, inverters, a battery management system, and a communications interface. The unit is integrated with BWP’s existing 265 kW on-campus solar photovoltaic generation system. The system will provide total peak power of up to 75 kW with a duration of 5.3 hours at rated discharge.
“Pairing the existing PV system allows the utility to charge the Energy Warehouse with solar generation,” Wang said. “It provides an opportunity for our system operators to get real-world experience in shifting the energy from solar generation to the hours in which it is most needed.”
The team opted for the iron flow battery because it has a higher storage capacity compared to similar technologies, providing the flexibility to align the power and amount of electricity stored to a project’s requirements while allowing for the possibility of future growth. The Energy Warehouse leverages electrochemistry and ESS Tech’s patented electrode design and control system to operate and remain stable over an unlimited number of deep charge and discharge cycles with no degradation or capacity fade. The iron flow battery container has a 320-square-foot footprint and is 9.5 feet high.
“ESS offered an energy technology with an impressive list of favorable attributes such as a greater number of cycles over a longer lifetime, sustainable material components, domestic manufacturing, and superior environmental and safety attributes,” Wang said. “There is a large appetite in the community to implement technology that is domestically manufactured and features superior environmental and safety attributes.”
The team began battery commissioning in the summer of 2024 and the demonstration period is scheduled to last 14 months. During that time, BWP has been collecting and analyzing data to assess the performance of the iron flow battery coupled with the solar system. Though it’s too early to share final outcomes, BWP expects positive results based on the site acceptance testing.
Improved Technology Forecasts
With so many new energy-related technologies entering the scene, utilities need a comprehensive view of current and potential offerings to support strategic planning, finances, and optimal load growth across customer types.
When Taunton Municipal Light Plant in Massachusetts began searching for a way to better predict and plan for distributed energy resource deployments, it quickly learned that existing solutions were not the right fit. Instead, the public power utility took matters into its own hands and created a tool to improve integrated resource planning by predicting future outcomes for multi-year DER deployments.
“We needed a developing and planning tool,” said Ben Thivierge, TMLP’s sustainability and commercial development specialist. “We wanted to gather information in one place to give us a forward-thinking view to make informed decisions.”
After many iterations and a year and a half of development with partner Beacon Climate Innovations, the utility launched the Community Energy & Efficiency Resource Unified Mapping Multi-Portal Information System, or CEERUM. The tool can help public power utilities with energy services, planning and programs, power supply and purchasing, and engineering operations, said Thivierge. CEERUM provides utilities with data-driven planning processes, a rapid scenario tool for roadmap development, a low-cost carbon inventory assessment, a dynamic climate action plan, information and research to support grant and finance applications, and a resource to assist decision-making and influencer assessment processes.
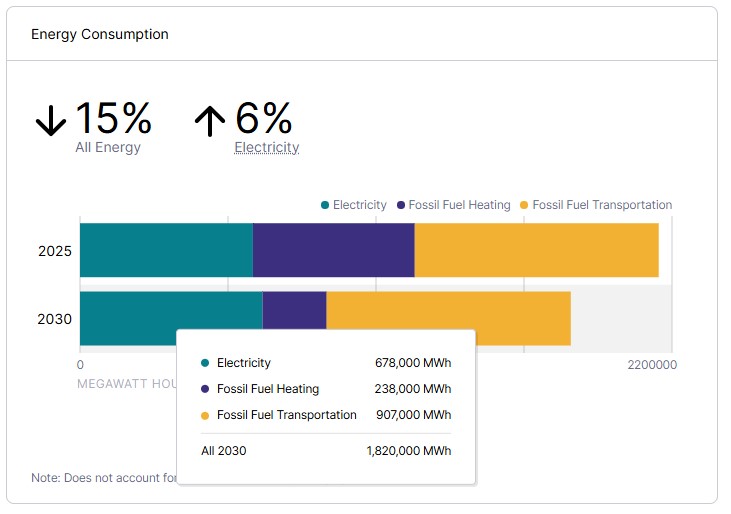
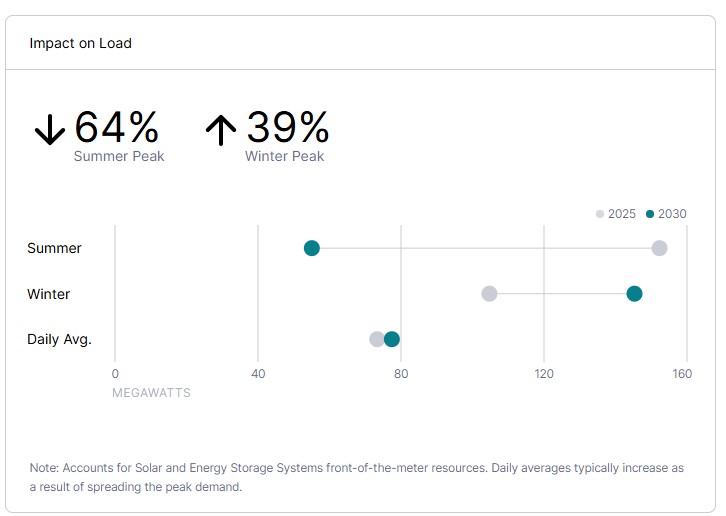
CEERUM can assess DER measures like weatherization, PV, battery energy storage systems, electrification, and demand response management to determine their impact on community-wide carbon emissions, energy consumption, and peak demand, as well as the utility’s investment costs and financial returns.
The system is designed to help find the right balance between offering incentives to customers and keeping rates affordable. For example, before a utility deploys an incentive program, CEERUM can demonstrate outcomes of various incentive levels to help utilities determine the most effective deployment strategies. If TMLP wants to encourage 50% of customers to own electric vehicles, it can use CEERUM to show how an incentive program would affect the load and determine ways to make it a viable option in the long run.
“If the system shows the EV program will be a load growth that could be uncontrolled, we could implement a demand response program that could curtail the uncontrolled growth by limiting when those customers discharge, impacting peaks and when they occur,” Thivierge said. “Seeing those outcomes visually backed by data makes us able to plan better.”
CEERUM also helps utilities troubleshoot their current plans for future growth. For example, if TMLP plans to build a new substation in 10 years, it can determine whether that timeline may need to be shortened to accommodate growth, or whether incentive programs need to be adjusted to ensure existing infrastructure can handle the load.
Tools like CEERUM benefit utilities of all sizes, but especially smaller utilities that may not have the staff or resources in-house for robust IRP. Utilities that want to use CEERUM can work with Beacon Climate Innovations to set up a personalized system. Beacon Climate Innovations will conduct a majority of the data collection from publicly available sources to input each utility’s rates, customer base and demographic information. CEERUM can provide a big-picture view based on estimated numbers, or users can input detailed data for more accurate results.
“We wanted a tool that could review programs and present possible outcomes to management,” Thivierge said. “Teams can review the impacts of one potential program, or they can dive into all of the programs offered to see the possibilities. They can generate high-level estimated numbers or get down in the details with actual numbers.”
TMLP serves just under 40,000 electric customers in the city in southeastern Massachusetts. TMLP’s results provide an example of how municipalities around the country can access standardized, affordable DER appraisal.