
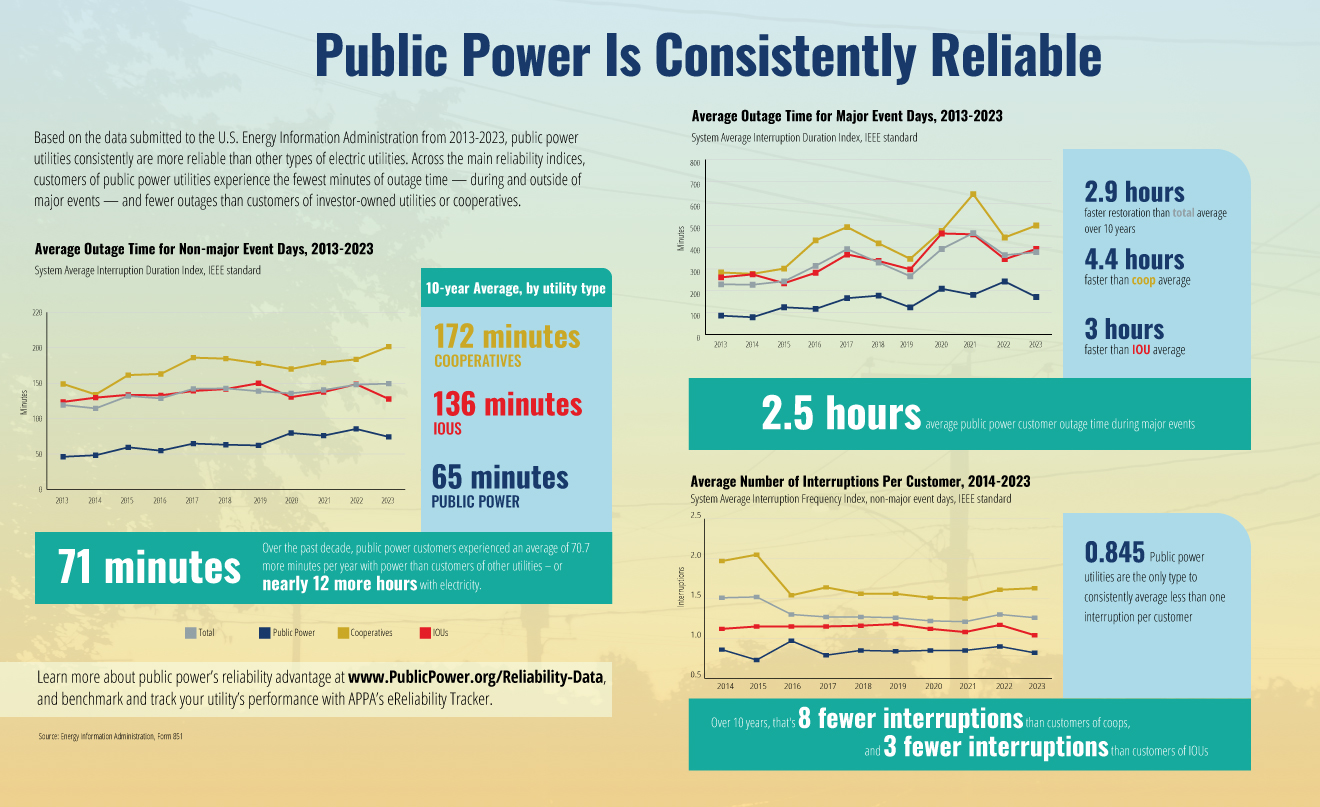
Based on the data submitted to the U.S. Energy Information Administration from 2013-2023, public power utilities consistently are more reliable than other types of electric utilities. Across the main reliability indices, customers of public power utilities experience the fewest minutes of outage time – during and outside of major events – and fewer outages than customers of investor-owned utilities or cooperatives.
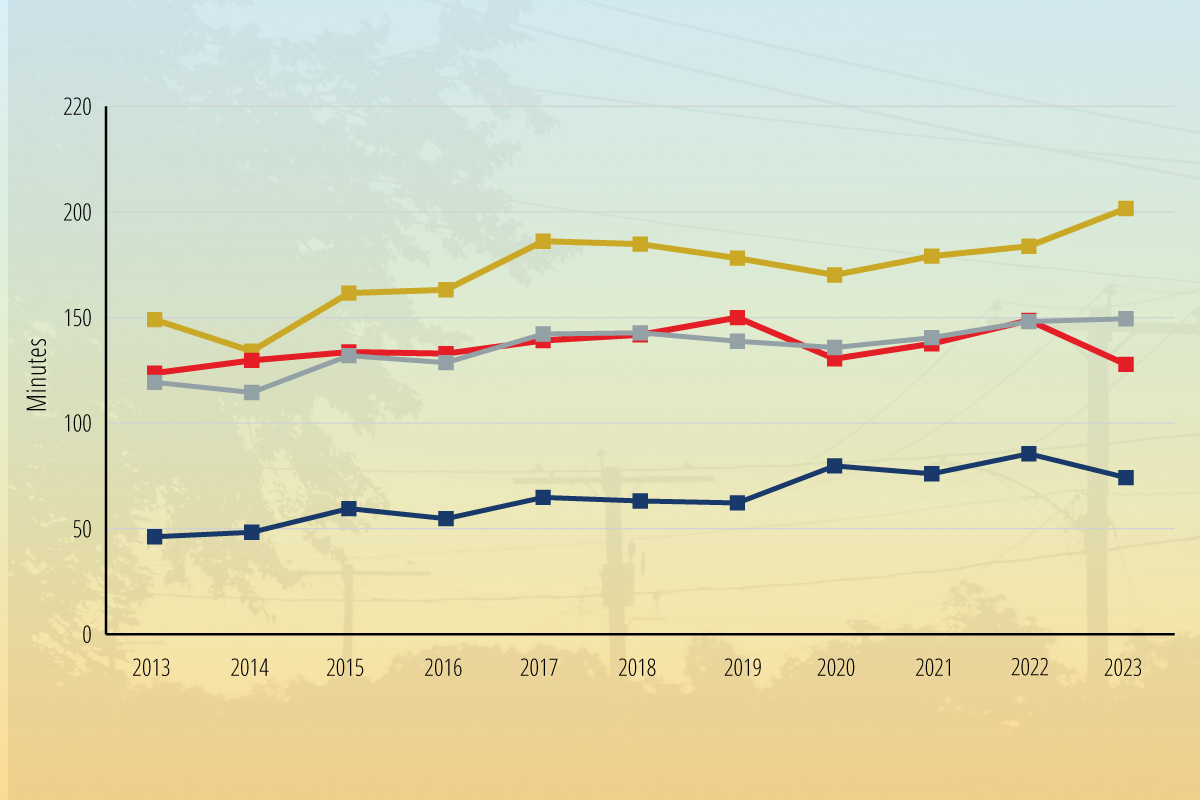
Average Outage Time for Non-major Event Days, 2013-2023
System Average Interruption Duration Index, IEEE standard
71 minutes |
Over the past decade, public power customers experienced an average of 70.7 more minutes per year with power than customers of other utilities – or nearly 12 more hours with electricity. |
10-year Average, by utility type |
|
| Cooperatives | 172 minutes |
| Investor-owned utilities | 136 minutes |
| Public power | 65 minutes |
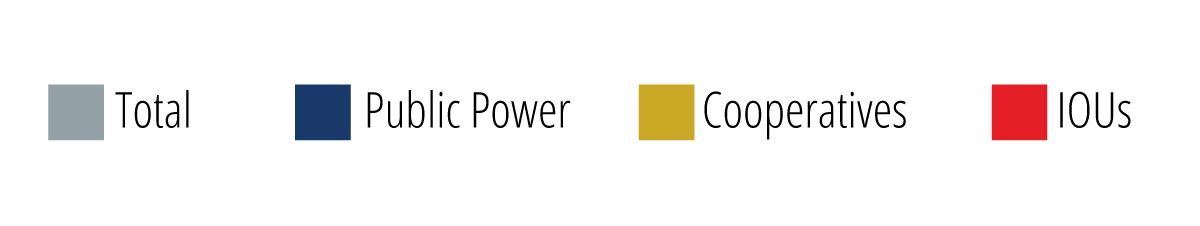
Average Outage Time for Major Event Days, 2013-2023
System Average Interruption Duration Index, IEEE standard
2.5 hours |
Average public power customer outage time during major events over the last decade
|
|
2.9 hours faster than total average over 10 years 4.4 hours faster than coop average 3 hours faster than IOU average |
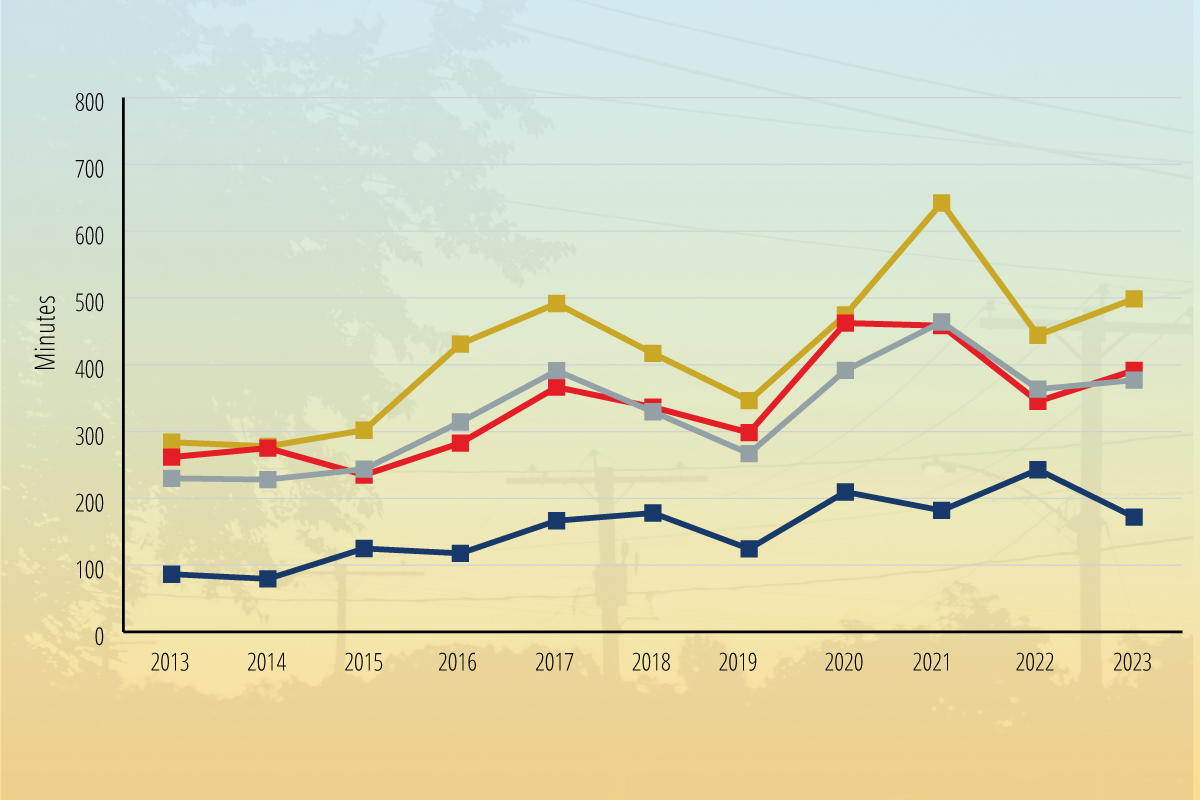
Average Interruptions per Customer for Non-major Event Days, 2014-2023
System Average Interruption Frequency Index, IEEE standard
0.845 |
Public power utilities are the only type to consistently average less than one interruption per customer Over 10 years, that’s 8 fewer interruptions than customers of coops, and 3 fewer interruptions than customers of IOUs. |
Learn more about public power’s reliability advantage on our Reliability Data page, and benchmark and track your utility’s performance with APPA’s eReliability Tracker.