
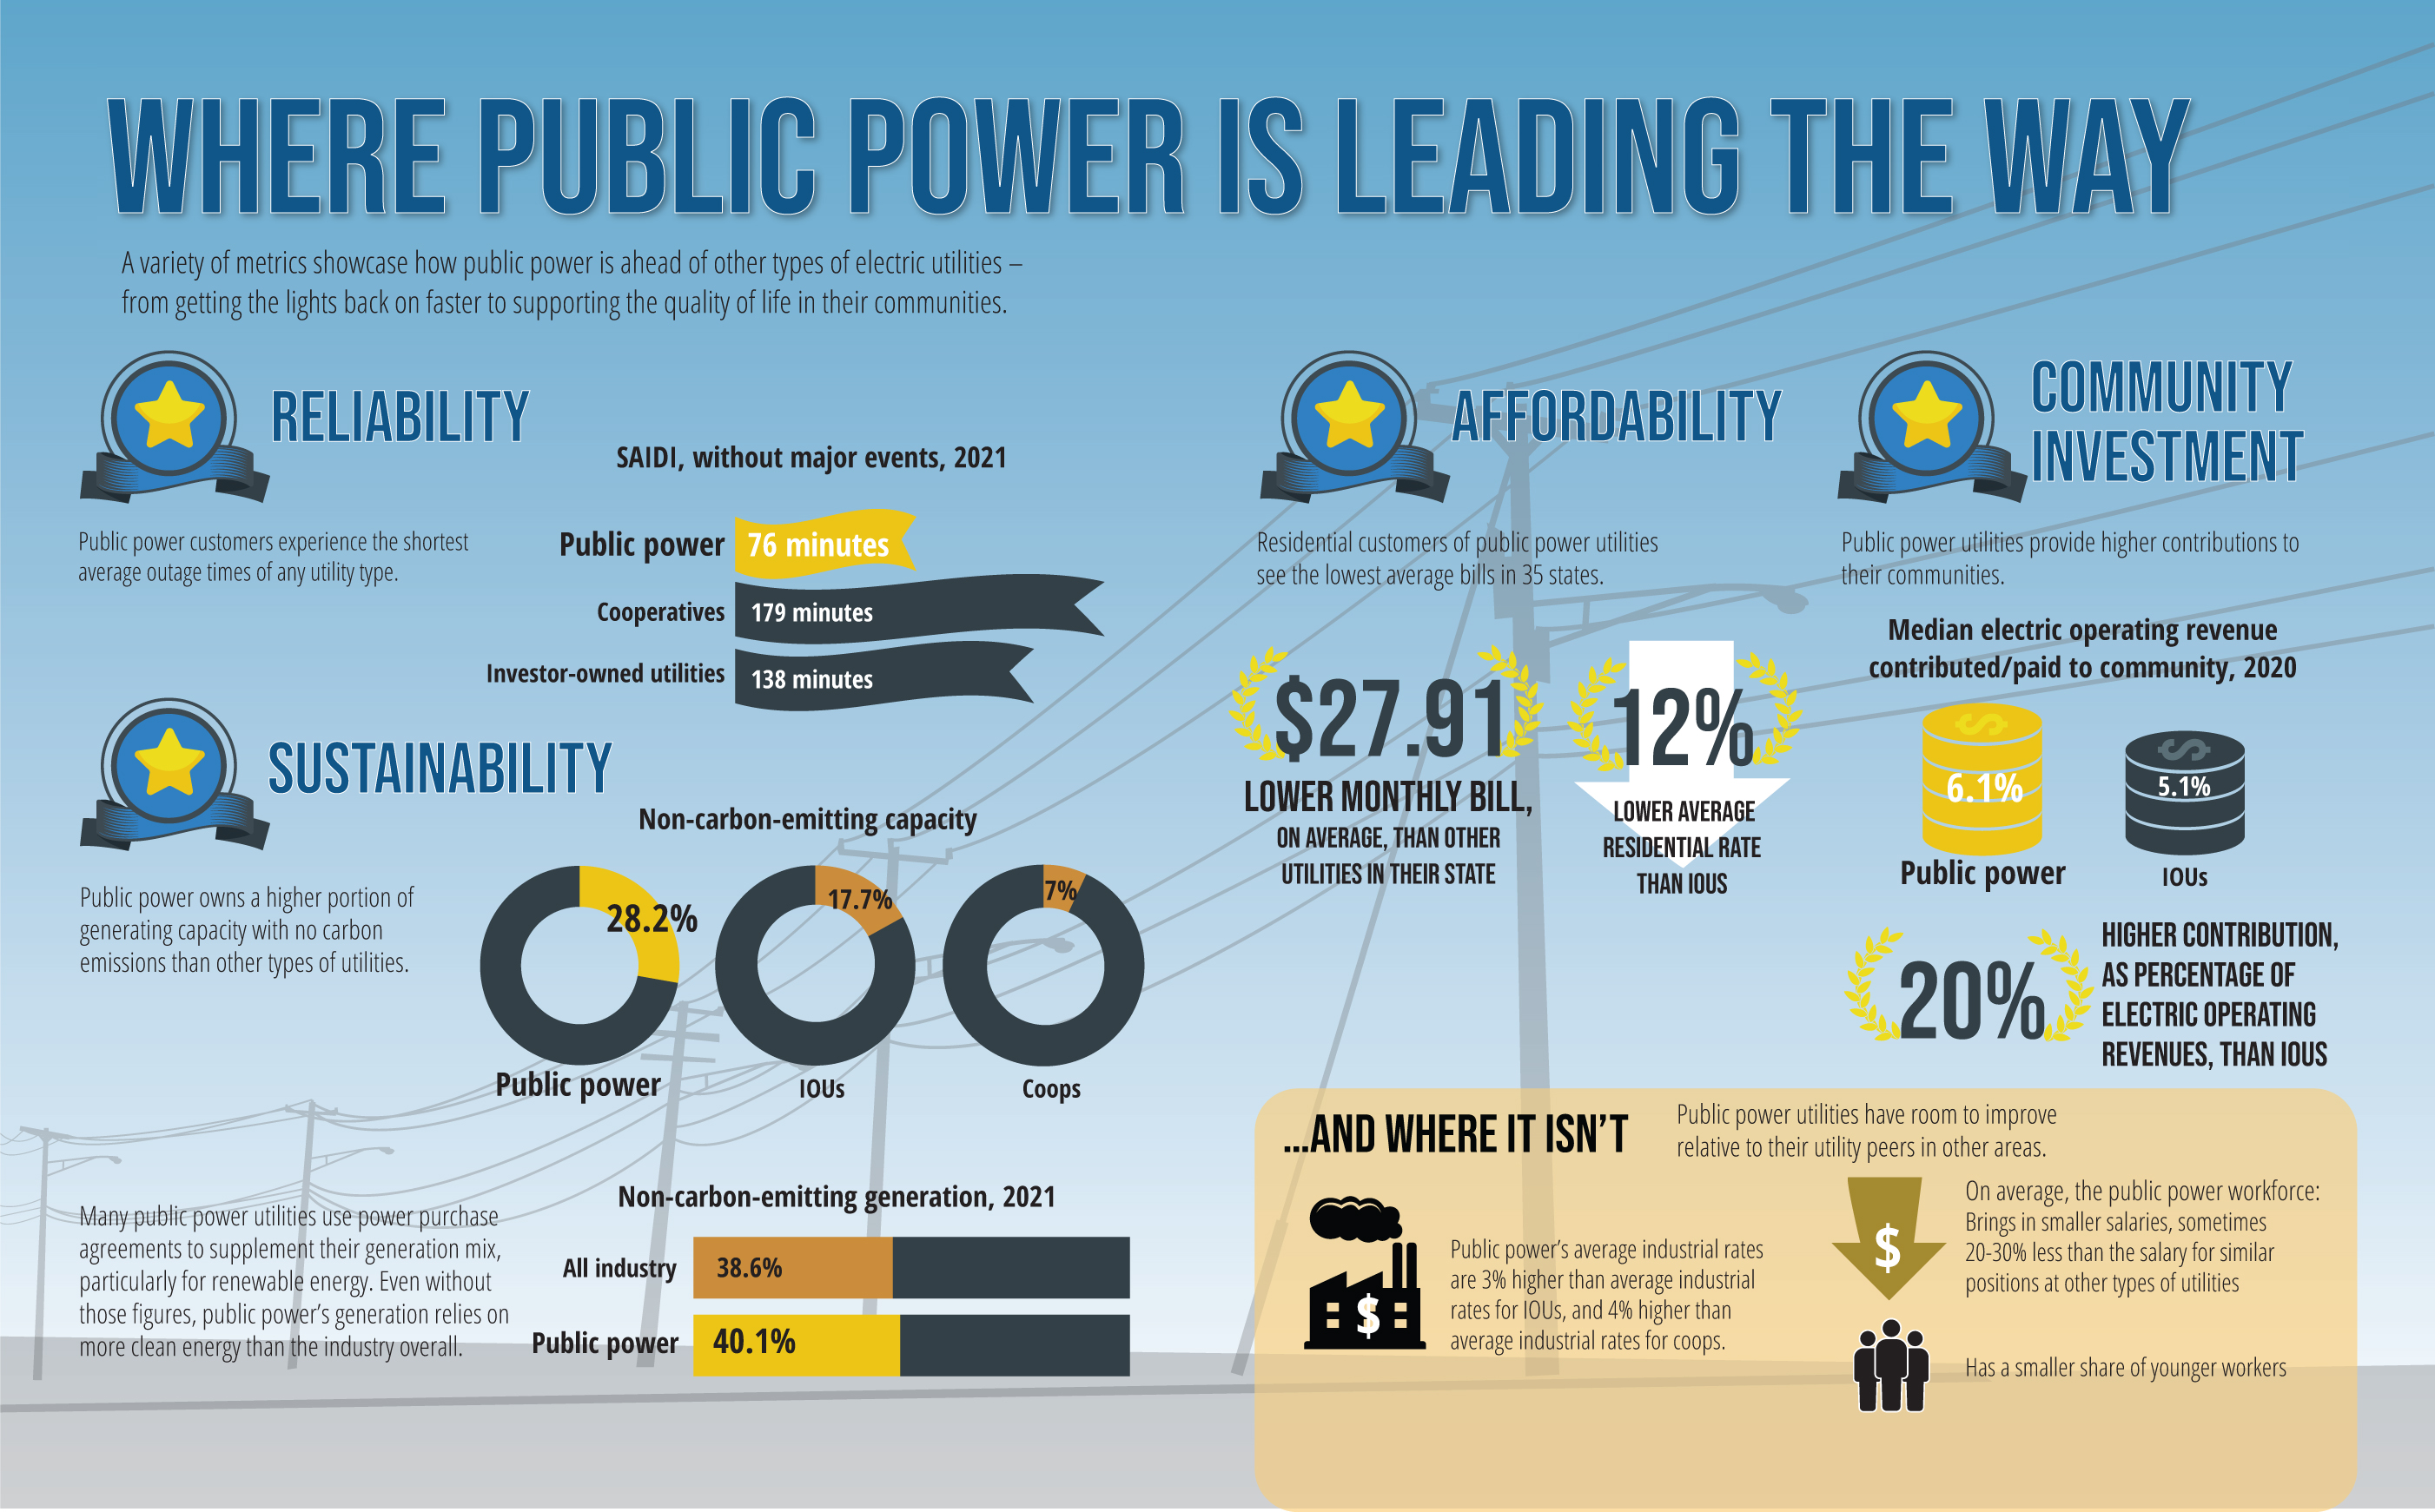
A variety of metrics showcase how public power is ahead of other types of electric utilities – from getting the lights back on faster to supporting the quality of life in their communities.
Reliability |
|
| Public power customers experience the shortest average outage times of any utility type. | |
 |
Affordability |
|
| Residential customers of public power utilities see the lowest average bills in 35 states. | |
  |
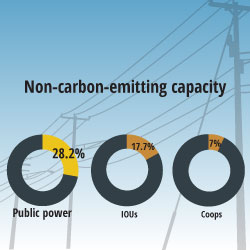
Sustainability |
|
| Public power owns a higher portion of generating capacity with no carbon emissions than other types of utilities. Many public power utilities use power purchase agreements to supplement their generation mix, particularly for renewable energy. Even without those figures, public power’s generation relies on more clean energy than the industry overall. | |
  |
Community Investment |
|
| Public power utilities provide higher contributions to their communities. Based on the percentage of electric operating revenues, public power utilities have a 20% higher median contribution than IOUs. | |
 |
...And Where it Isn't
Public power utilities have room to improve relative to their utility peers in other areas.
On average, the public power workforce:
- Brings in smaller salaries, sometimes 20-30% less than the salary for similar positions at other types of utilities
- Has a smaller share of younger workers
Public power’s average industrial rates are 3% higher than average industrial rates for IOUs, and 4% higher than average industrial rates for coops.